ECG Interpretation
- Medicine Revision Crash Course

- Sep 22, 2019
- 3 min read
Updated: Jan 7, 2020
Introduction:
Confirm the name and date of birth of the patient matches the details that on the ECG strip
Confirm the date and time the ECG was performed, and note if any others have been performed recently for this patient (to act as a comparison)
1. Heart rate
Bradycardia = <60bpm
Normal = 60-100bpm
Tachycardia = >100bpm
There are a couple of ways to calculate the heart rate:


2. Rhythm
Regular - recurrent pattern of P, QRS and T waves at regular intervals
Irregular rhythms can be:
Regularly irregular (A recurrent pattern of irregularity - Ectopic beats)
Irregularly irregular (Completely disorganised - Atrial fibrillation)
How to check if the rhythm is regular?
Mark out several consecutive R-R intervals on a piece of paper, then move them along the rhythm strip to check if the subsequent intervals are the same.
3. Axis
People often find it difficult to determine if there is any deviation in the axis!
Below is a table that summarises normal axis vs right axis deviation vs left axis deviation.

LAD= Leaving
Physiological – Age related, short/stocky
Indicates: LVH, LBBB, LAFB, Inf MI, paced, VEB
RAD= Reaching
Physiological – Thin patients or children
Indicates: RVH, RBBB, LPFB, latMI, COPD, PulHTN, PE
4. P waves
Duration = Less than 120 ms wide and less than 2.5 mm high
Are P-waves present?
Is each P-wave followed by a QRS complex?
Do the P-waves look normal? (check duration, direction and shape)
5. P-R interval
Duration = 120 to 200 ms wide (aka 3-5 small squares)
A prolonged PR interval suggests there is atrioventricular delay (AV block)
Long PR
Heart block - First (>0.20ms)
Mobitz-type I heart block= Prolonged >20ms then drop QRS
Short PR
Pre-excitation = WPW (wide QRS, delta waves)
AV nodal rhythm
6. QRS complex
Duration = 0.12 seconds
Pathological Q wave = Previous MI
A narrow QRS complex occurs when the impulse is conducted down the bundle of His and the Purkinje fibre to the ventricles. This results in well organised synchronised ventricular depolarisation.
A broad QRS complex occurs if there is an abnormal depolarisation sequence - eg: A bundle branch block results in a broad QRS because the impulse gets to one ventricle rapidly down the intrinsic conduction system then has to spread slowly across the myocardium to the other ventricle.


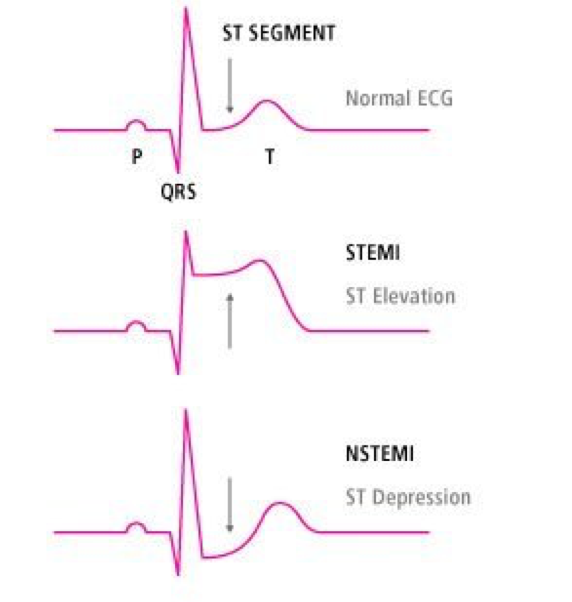
7. ST segment
ST elevation – Acute MI >1mm 2 consistent, or >2mm chest
ST depression - MI
Saddle shaped - Acute pericarditits

Anterior STEMI - V1-V4
Lateral STEMI – I avL and V5-6
Inferior STEMI - II, III and aVF
8. T wave
Should all be positive except for aVR and V1
T wave inversion - ischaemia, hypokalaemia
Peaked T waves - hyperkalaemia ('Tall tented')
Flattened - ischaemia or electrolyte imbalance
T waves are tall if they are:
>5mm in the limb leads AND >10mm in the chest leads
9. QT interval
Men 440ms
Women 460ms
Increased HR = decreased QT
Prolonged- Risk of torsade de pointe
Acquired- amiodarone, antipsychotics/ Ads, electrolytes
Congenital – Romano Ward
10. U wave
After T, same direction
Seen more in a patient with bradycardia
Prominent U waves: >1-2mm, same as T
Bradycardia
Hypokalaemia
Inverted U waves:
Cardiac disease + chest pain= MI
Time to practice:

1. Atrial Fibrillation
Irregularly irregular rhythm
No P waves
Absence of an isoelectric baseline
Variable ventricular rate

2. Atrial flutter
Narrow complex tachycardia
Regular atrial activity at ~300 bpm
Flutter waves (“saw-tooth” pattern) best seen in leads II, III, aVF
Loss of the isoelectric baseline

3. Hyperkalaemia
Prolonged PR interval
Broad, bizarre QRS complexes — these merge with both the preceding P wave and subsequent T wave
Peaked T waves ('Tall tented')

4. Anterior STEMI
ST elevation is maximal in the anteroseptal leads (V1-4)
Q waves are present in the septal leads (V1-2)
There are hyperacute (peaked) T waves in V2-4
These features indicate a hyperacute anteroseptal STEMI

5. 1st degree heart block
Sinus bradycardia with 1st degree AV block
PR interval > 300 ms

6. Inferior STEMI
Marked ST elevation in II, III and aVF with early Q-wave formation
Reciprocal changes in aVL


Join GD Goenka Healthcare Academy for a Diploma in Dialysis Technician in Bhilwara and build a rewarding career in the healthcare industry with expert training and hands-on experience